After experimenting with T37-6 yellow core inductors, it was time to change to the T37-2 red core. These have a lower operating frequency, up to 10 MHz, and it is possible that they might have a higher attenuation on 14 MHz and up because of that. The toroid calculator indicated that 17 turns would produce a similar 1.2 uH coil. That worked out to 12 inches of #20 wire, still more than a single layer can deal with, but I’ll put up with 4 turns of overlap.
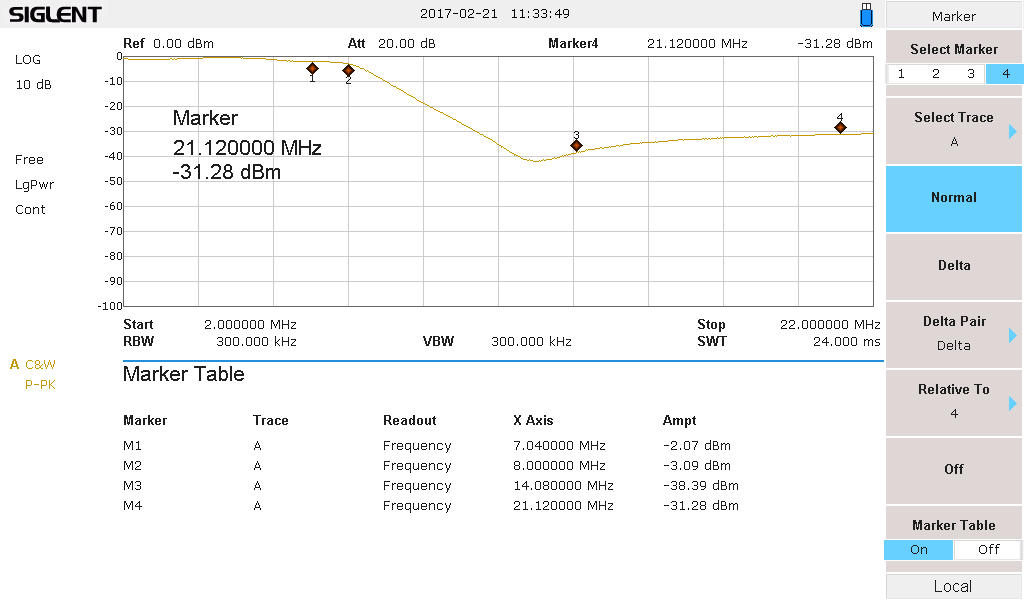
It was immediately apparent that the filter response was different. The loss at 7.040 MHz was lower and the attenuation at 14/21/28 was higher by a few dB.
| Yellow 19 Turns | Red 17 Turns | |
| 7.04 MHz | -2.33 dB | -2.07 dB |
| Knee -3 dB | 7.84 MHz | 8.00 MHz |
| 14.08 MHz | -35.4 dB | -38.4 dB |
| 21.12 MHz | -29.0 dB | -31.3 dB |
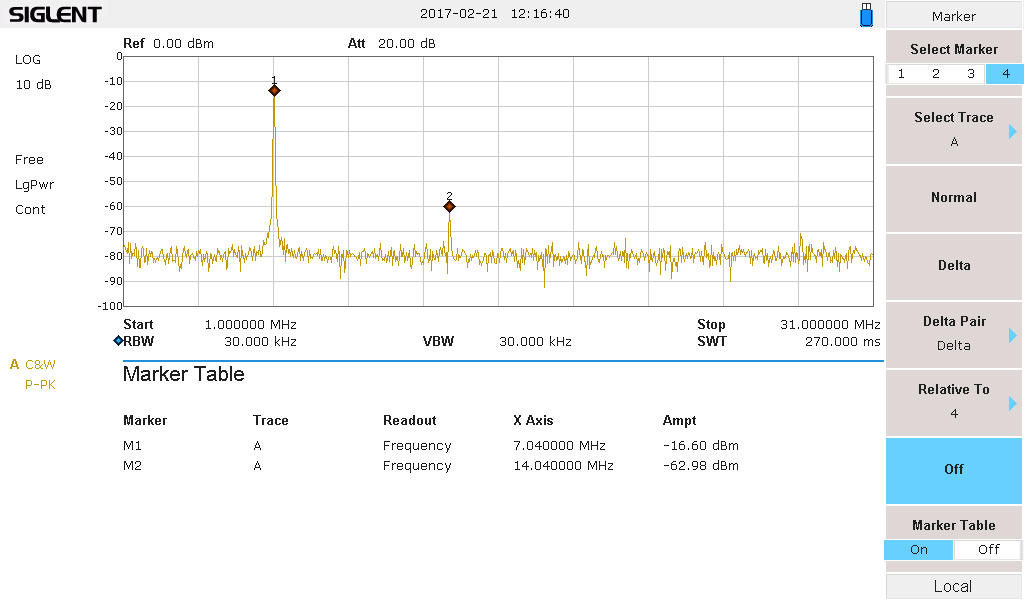
When added to the output of my Pixie, which was producing lots of harmonics (14 MHz was only 10 dB down from the carrier), the red core filter was a substantial improvement compared to the yellow core.
The second harmonic has been reduced 46.4 dB below the carrier. The Pixie is Passing the FCC limit of -43 dBc.
| Yellow 19 Turns | Red 17 Turns | |
| Meter Power | 230 mW | 250 mW |
| 7.040 MHz | -21.6 dBm | -16.6 dBm |
| 14.08 MHz | -60.9 dBm | -63.0 dBm |
| 21.12 MHz | -77.1 dBm | < -80 dBm |
The Pixie has the Red Core Filter in series with its output. The output of the filter is fed into an external 40 dB attenuator. The attenuator output is fed into the input of the Spectrum Analyzer. Thus the measured 7.040 MHz signal at -16.6 dBm is actually -16.6 dBm + 40 dB, or +23.4 dBm. That is 219 mW.
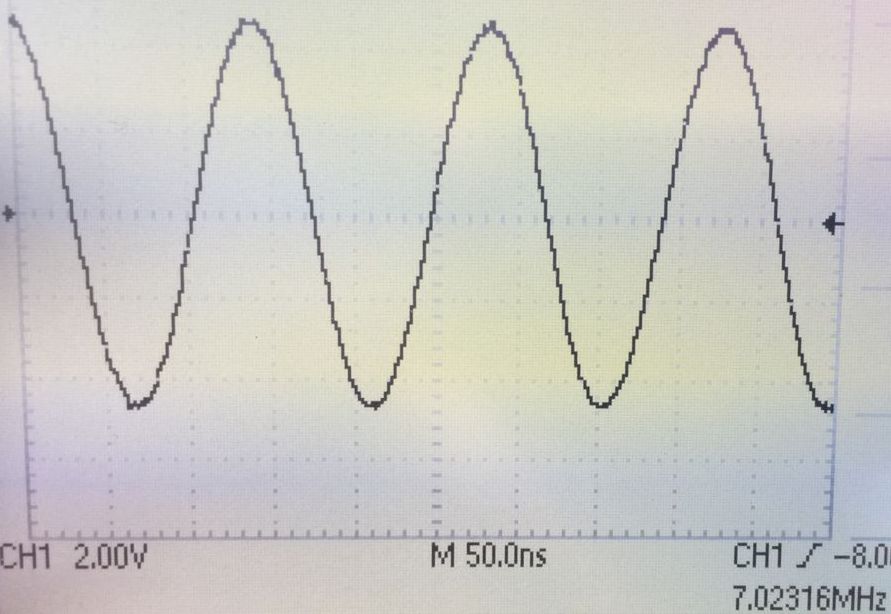
As one might expect the output of the Pixie now looks like a real sine wave with the harmonics suppressed. By measurement, the signal is 9.4 vpp, or 3.3 vrms. That corresponds to 221 mW into 50 Ohms.


Thanks for publishing this.
–KB5RZP