Does Size Matter?

There’s a joke in there somewhere…

Yes, size does matter when it comes to Toroid diameter (which also has an impact on winding geometry), maximum wire size, etc.  All things which impact the Q of the circuit.

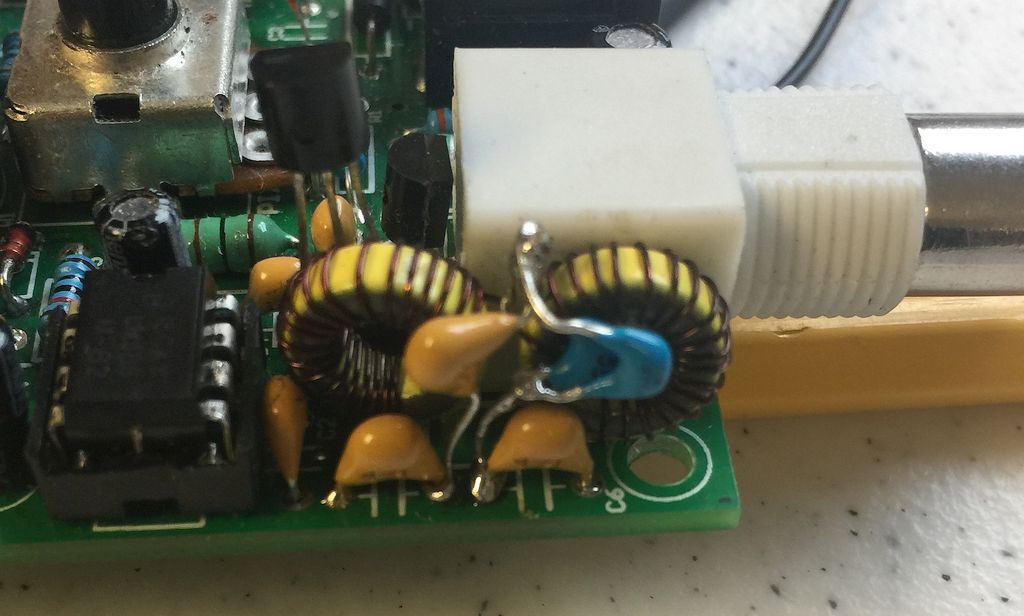
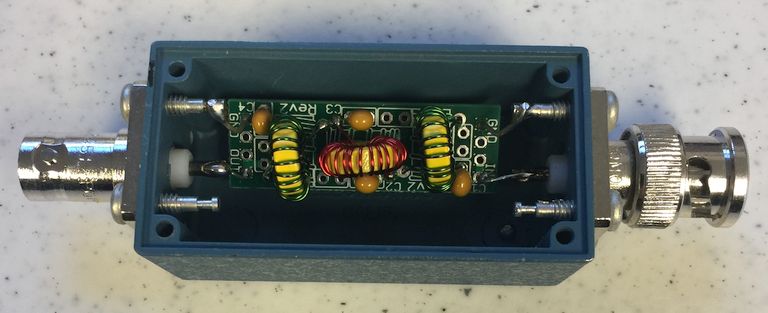
I went back to my original S8050 Transistor, and swapped out my T37-2 inductors for T50-2 inductors wound with 15 turns of #20 wire (13″ of wire, measuring 1.2 uH).  This allowed the winding to be single layer and evenly spaced (the smaller T37 cores had to go to two layers and were really jammed in there).

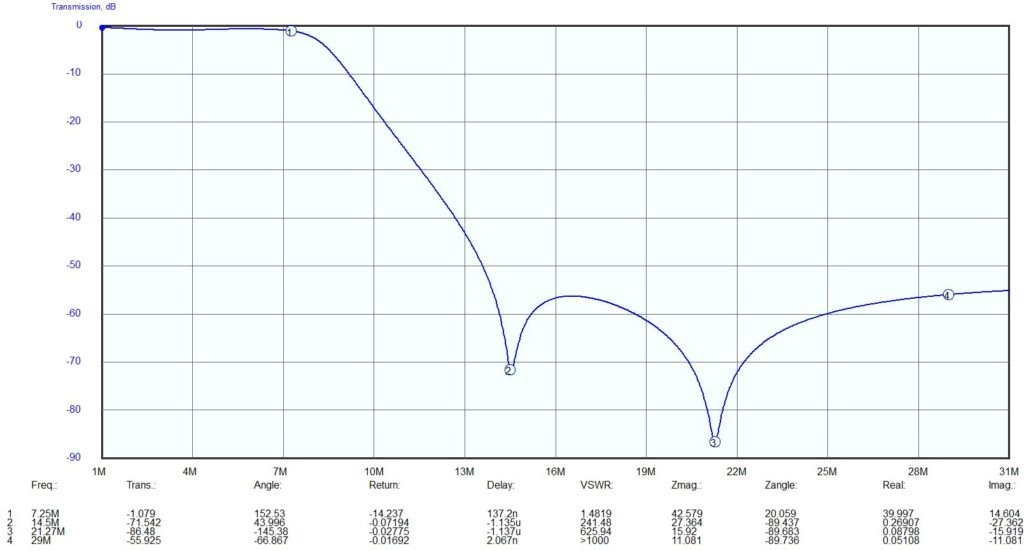
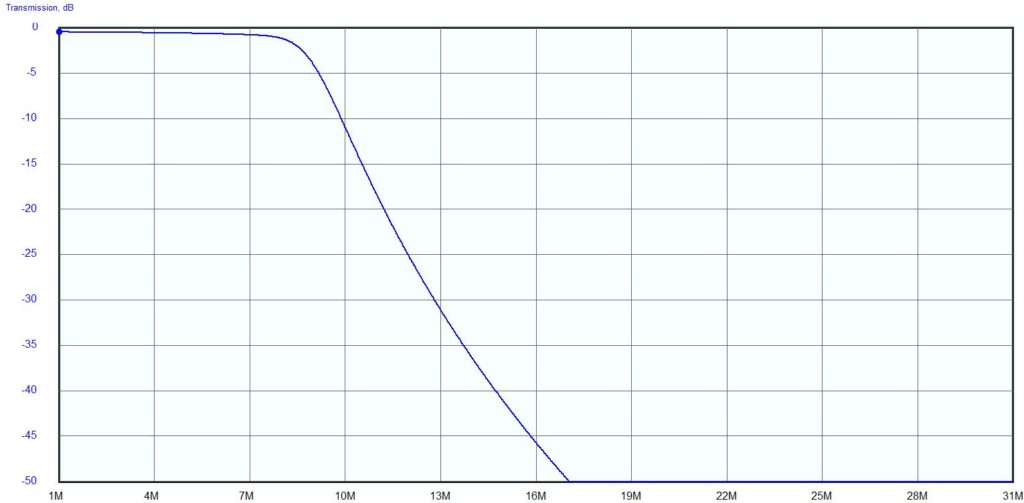
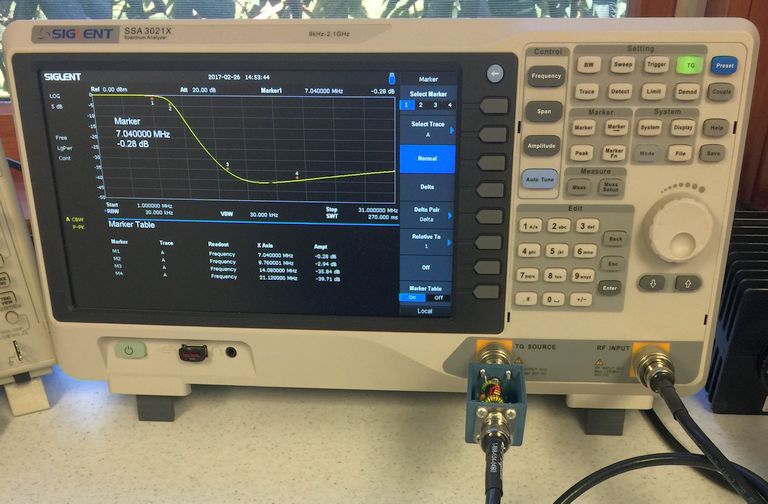
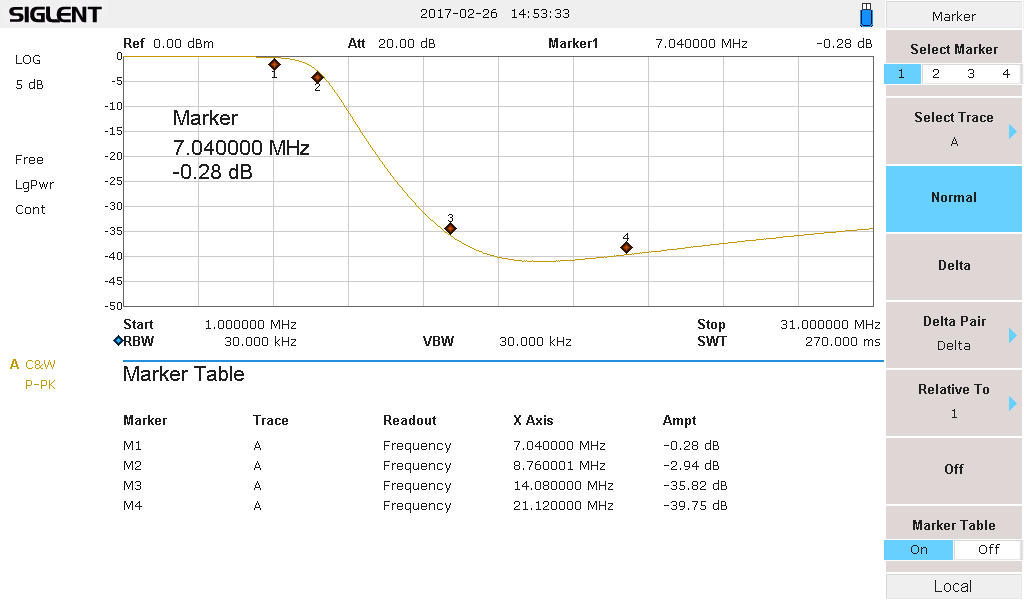
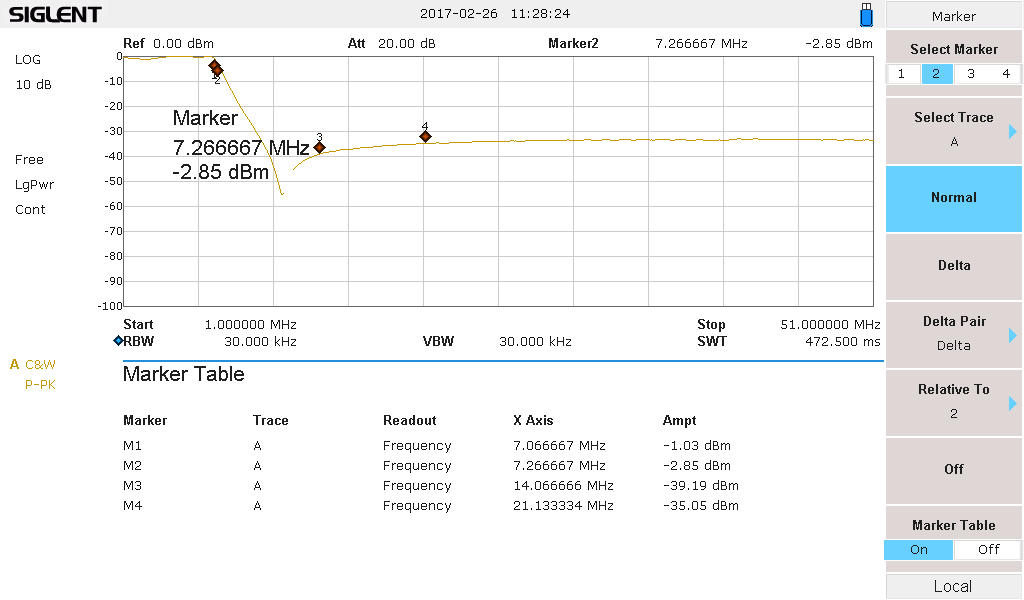
I had seen Q readings at 100KHz of 20 for the T37-6, 25 for the T37-2.  The larger T50-2 inductors had a Q of 45.  The higher the Q, the lower the insertion loss, so larger cores with heavier gauge wire are better.  That’s the same conclusion that is reached in the Micrometals Q Curve App Note (I’m using Micrometals cores).  The filter response curve was very similar but at 7.040 Mhz the loss was now -1.97 dB, about a 0.1 dB improvement.

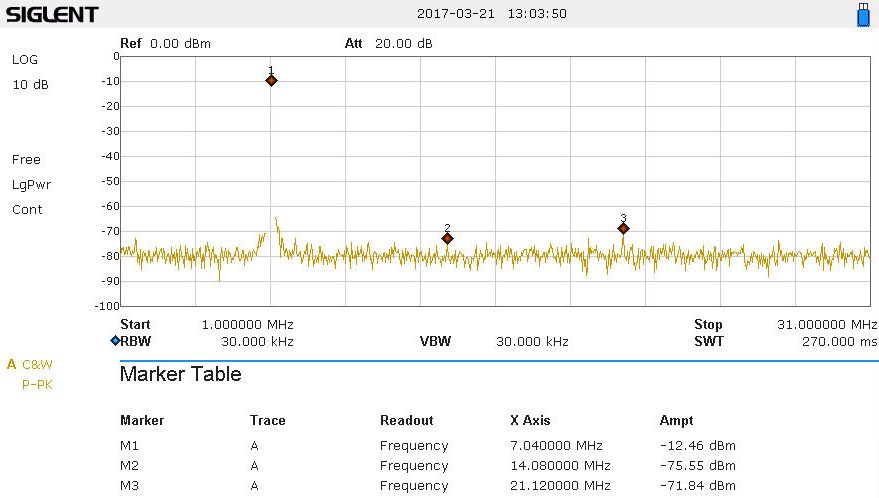
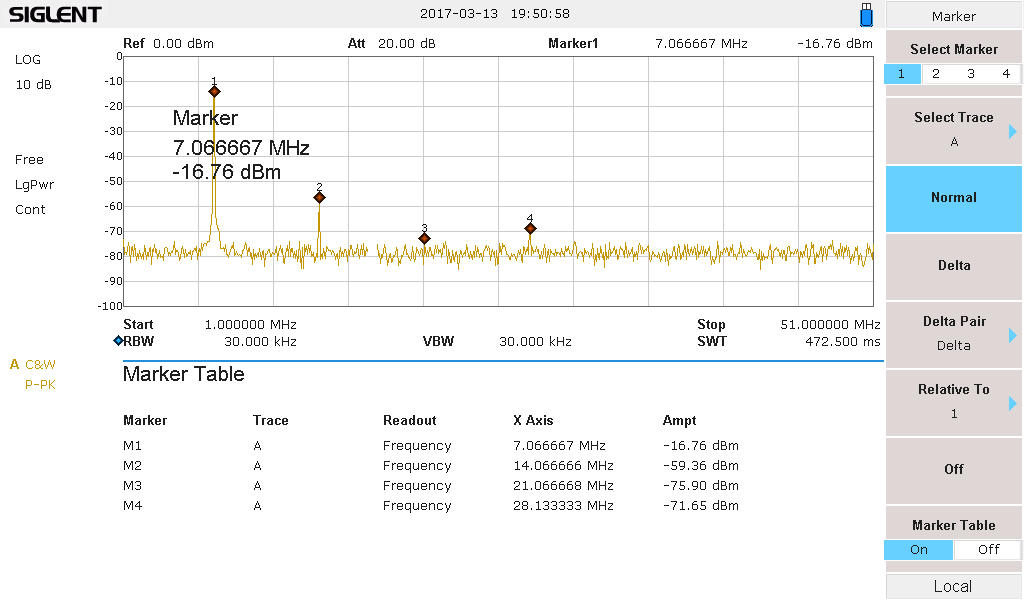
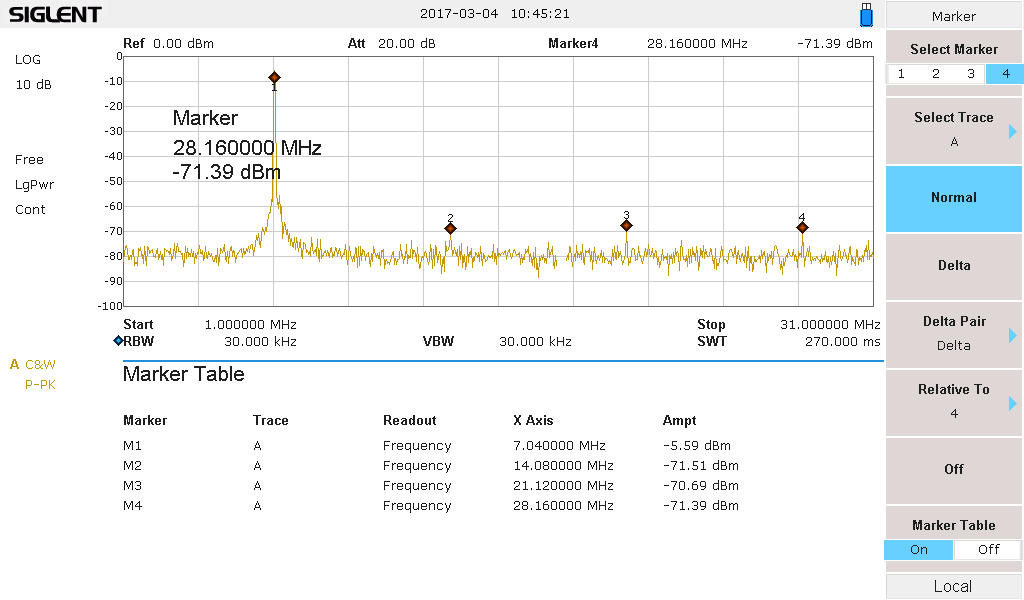
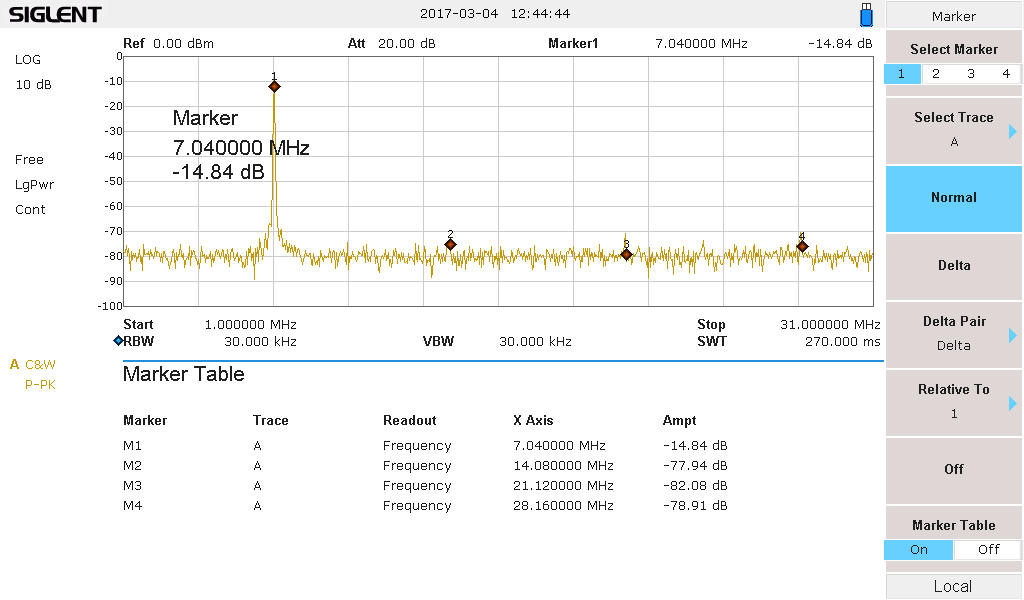
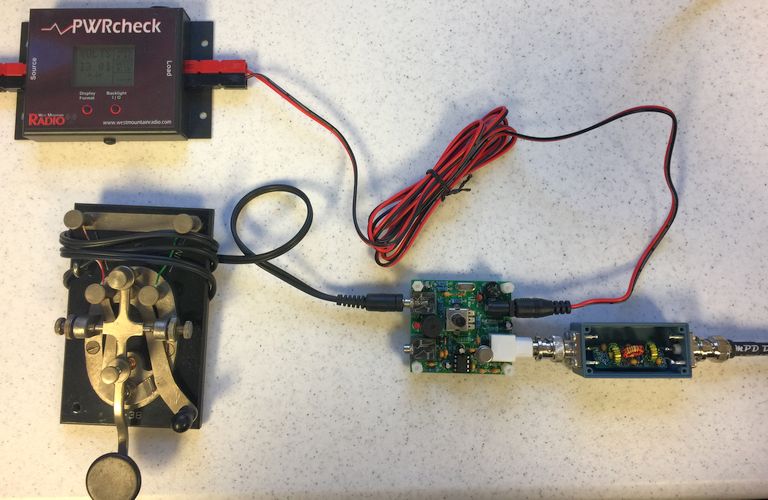
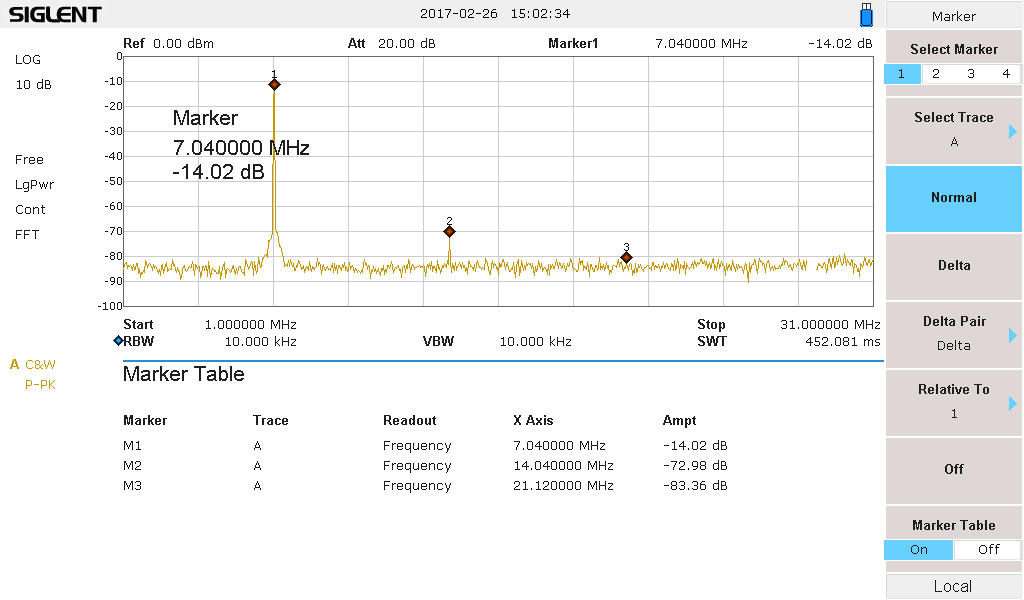
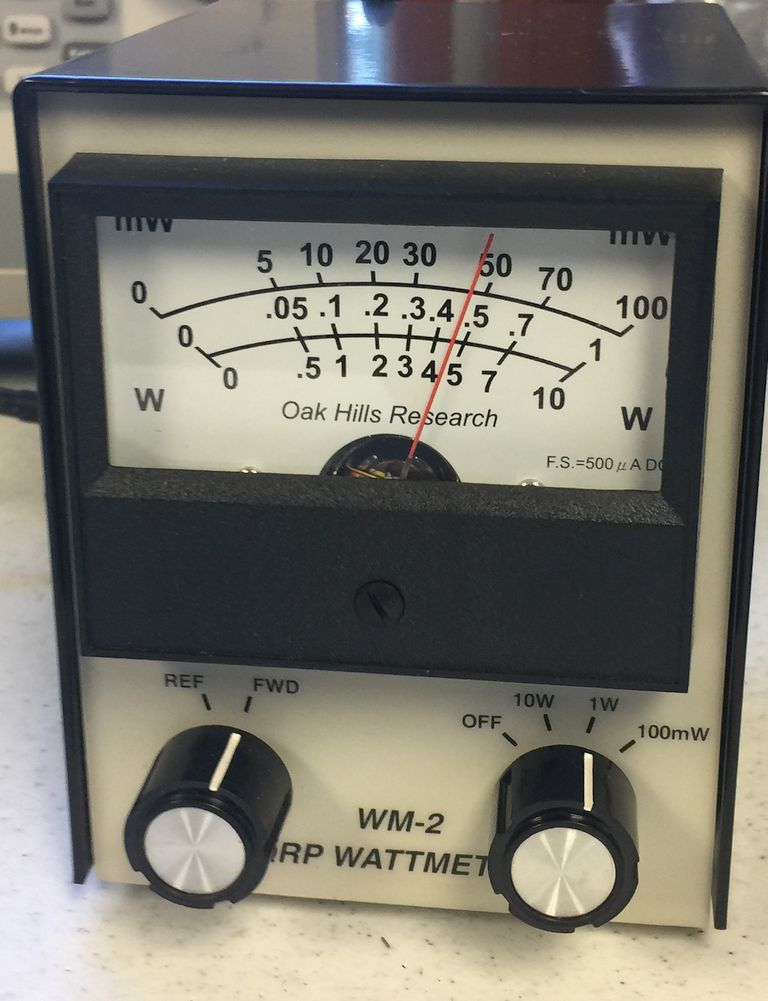
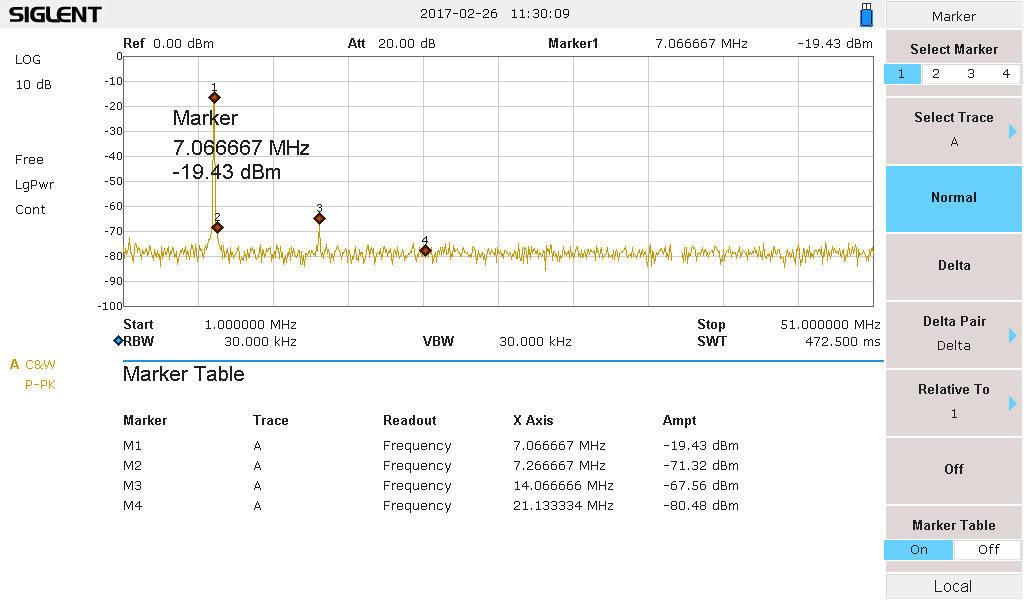
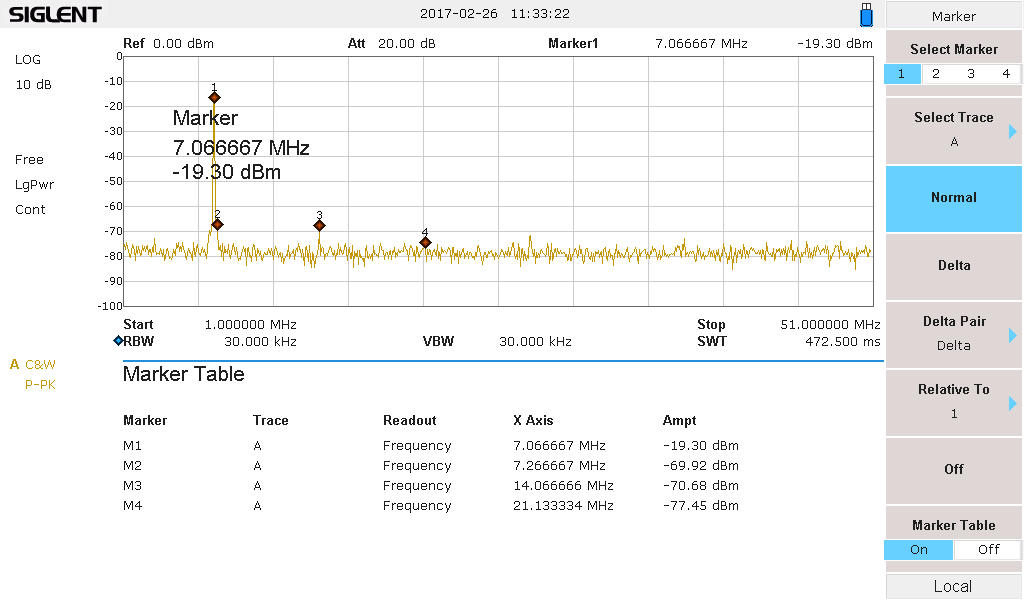
With the filter using the T50-2 cores the spurious response output looks like this (Meter reading just about 270 mW, 2nd harmonic down -45 dB, fundamental at 220 mW).

T37-2 17 turns #20 T50-2 15 turns #20
Meter Power 250 mW 270 mW
7.040 MHz -16.6 dBm -16.7 dBm
14.08 MHz -63.0 dBm -61.6 dBm
21.12 MHz <-80.0 dBm < -80 dBm

Proving again that basic physics never gets old, here is a great reference from Boonton Radio Corporation, circa 1955, that describes a Q-Meter and how you can evaluate components.  (Thanks to John, WA1ABI, for this great article!)

Posted in Projects, QRP | Leave a comment

A New Transistor for the Pixie

Of course the Pixie final transistor, Q2 S8050, gets darned hot, and I’ve blown one out in the past just holding the key down more than a few seconds.  With my Pixie + Red Core Filter, I was seeing about 250 mW out on my QRP meter.

I decided to replace Q2 with an old 2N2219 NPN transistor (one of the few metal can devices I had in my part box).  Sure enough, that old device, circa 1975, had better performance than the S8050.  My output meter was now about 320 mW out (SA was reading +24.3 mW or 270 mW), and the 2nd harmonic was 50 dB down.  A new 4th harmonic showed up, but was also 50 dB down.

Playing around with the output transistor will likely yield some improvements.

When viewed from above, with the board rotated so the BNC connector would be on the right-hand side, Q2 will be flat-side toward the bottom edge of the board, and the pin-out is EBC from left to right, as shown below.

Posted in Gear, Pixie, Projects, QRP | Leave a comment

Passing Pixie!

After experimenting with T37-6 yellow core inductors, it was time to change to the T37-2 red core.  These have a lower operating frequency, up to 10 MHz, and it is possible that they might have a higher attenuation on 14 MHz and up because of that.  The toroid calculator indicated that 17 turns would produce a similar 1.2 uH coil.  That worked out to 12 inches of #20 wire, still more than a single layer can deal with, but I’ll put up with 4 turns of overlap.

It was immediately apparent that the filter response was different.  The loss at 7.040 MHz was lower and the attenuation at 14/21/28 was higher by a few dB.

Yellow 19 Turns Red 17 Turns
7.04 MHz -2.33 dB -2.07 dB
Knee -3 dB 7.84 MHz 8.00 MHz
14.08 MHz -35.4 dB -38.4 dB
21.12 MHz -29.0 dB -31.3 dB

When added to the output of my Pixie, which was producing lots of harmonics (14 MHz was only 10 dB down from the carrier), the red core filter was a substantial improvement compared to the yellow core.

The second harmonic has been reduced 46.4 dB below the carrier.  The Pixie is Passing the FCC limit of -43 dBc.

Yellow 19 Turns Red 17 Turns
Meter Power 230 mW 250 mW
7.040 MHz -21.6 dBm -16.6 dBm
14.08 MHz -60.9 dBm -63.0 dBm
21.12 MHz -77.1 dBm < -80 dBm

The Pixie has the Red Core Filter in series with its output.  The output of the filter is fed into an external 40 dB attenuator.  The attenuator output is fed into the input of the Spectrum Analyzer.  Thus the measured 7.040 MHz signal at -16.6 dBm is actually -16.6 dBm + 40 dB, or +23.4 dBm.  That is 219 mW.

As one might expect the output of the Pixie now looks like a real sine wave with the harmonics suppressed.  By measurement, the signal is 9.4 vpp, or 3.3 vrms.   That corresponds to 221 mW into 50 Ohms.


Posted in Gear, Pixie, Projects, QRP | 1 Comment

Pixie PLUS 5-Pole LPF

My Pixie produces about 500 mW of output power when driven by a 13.8 volt supply.  The total input power to the board is about 1.5 watts.  As I’ve mentioned the Pixie only suppresses the 2nd harmonic by about 10 dB with it’s internal filter.

Pixie running at 13.8 volts, producing 500 mW output, with second harmonic down 9.5 dB from carrier

When I added the 5-pole filter that I described in my last post to the Pixie minus one turn on each coil, so 19 turns each (keeping the original filter in place), the output power was reduced to 250 mW, but the 2nd harmonic reduction was improved to -40.7 dBc; almost passing!

Pixie running at 13.8 volts, with 5-pole filter on output, producing 250 mW output, with second harmonic down 40.7 dB from carrier; just 2.3 dB above FCC limit


Recall that other Pixies I have tested have 2nd harmonic suppression of about 20 dB.  That will probably allow the additional filter to meet FCC requirements.

I also removed another turn off of each inductor, but only observed a slight improvement in output power (it went up to 280 mW).  The 2nd harmonic suppression was negatively impacted as well, now only 37.5 dB below the carrier.

Posted in Pixie, Projects, QRP | Leave a comment

A 40 Meter LPF for the Pixie

As I mentioned the 40-meter Pixie QRP rig has pretty horrible harmonics, well above the maximum allowable FCC limit (-43 dBc).  One Pixie was about -9 dBc, and the other was about -20 dBc.

The output filter in the Pixie is a simple 3-pole PI network, clearly not up to snuff.  With judicial parts placement, an extra 5-pole filter could be installed, but it probably makes sense to install it in an external box (Like a Pomona 3231 or 2391).

Several club members and I embarked on experiments to build a prototype filter, with some different choices of -3 dB cutoff frequency, output ripple, etc.  We also discovered that while many of the online calculators produced very similar results, at least one of them does not.  Filters built using those values did not match up well with predicted results.

John King, WA1ABI, suggested using “Elsie” from Tonne Software.  Far more flexible than the online calculators, it produced output values that were consistent as long as the initial parameters were correctly selected.  The software can be downloaded here:

http://www.tonnesoftware.com/elsiedownload.html

I used an online calculator that produced identical results to Elsie:

http://www.calculatoredge.com/electronics/ch%20pi%20low%20pass.htm

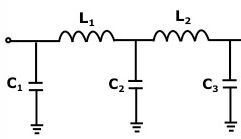
Input values were a cutoff frequency of 7.5 MHz, 50 Ohm impedance, 1 dB ripple, and a 5-pole Chebyshev filter.  That produced the C1/C2/C3 & L1/L2 values shown below:


C1 & C3 were fabricated from a 680 pF in parallel with a 220 pF, for a total of 900 pF (less than 1% low).

C2 was fabricated from three caps in parallel; 470 pF, 470 pF, and 330 pF, for a total of 1270 pF (less than 1% low).


My inductor was set to 1.2 uH, about 4% high, but that required 20 turns on a #6 core.

I had chosen T37 cores for their small size and had initially planned on winding them with #26 wire.  However I switched to #20 for mechanical reasons.  A T37 core can hold about 13 turns of #20 in a single layer, and 20 turns of #20 in a dual layer — perfect.  14″ of #20 magnet wire was enough to wind 20 turns with 1.5″ long pigtails.  It was tight, but things fit.


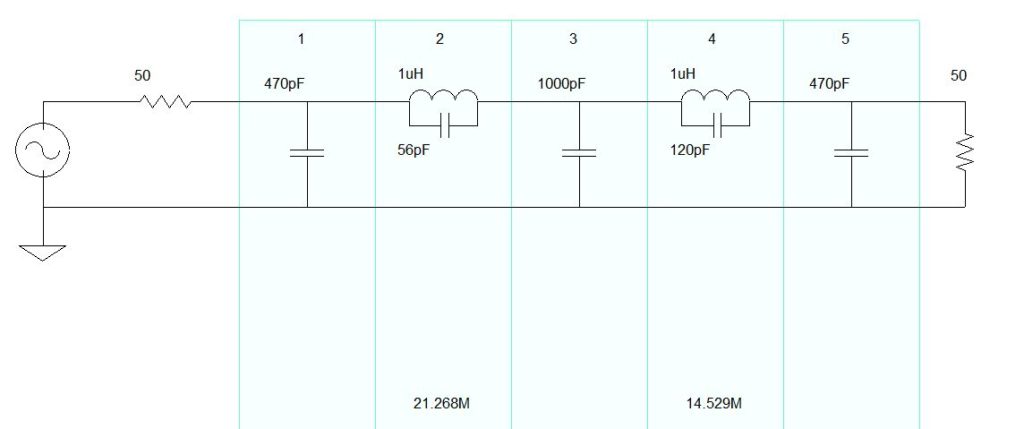
The final breadboard circuit looked like this:


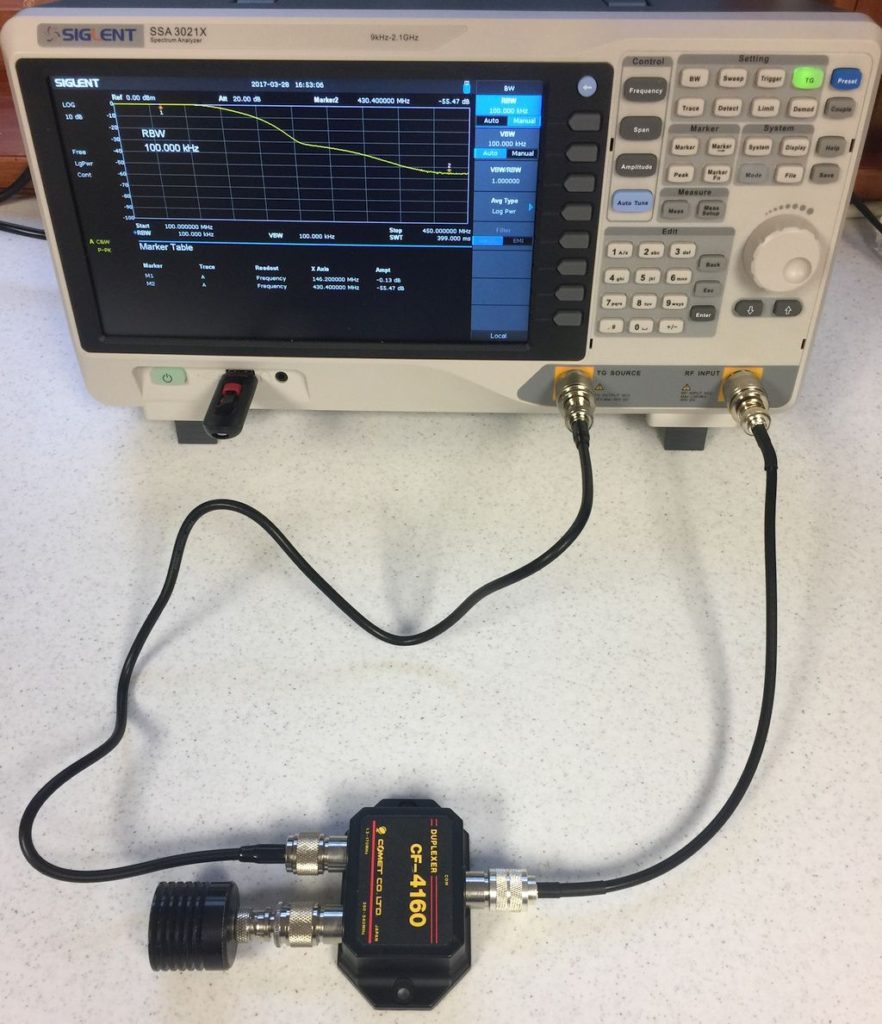
The test setup looked like this, with the breadboard hooked up in series between the Tracking Generator output and Spectrum Analyzer input:


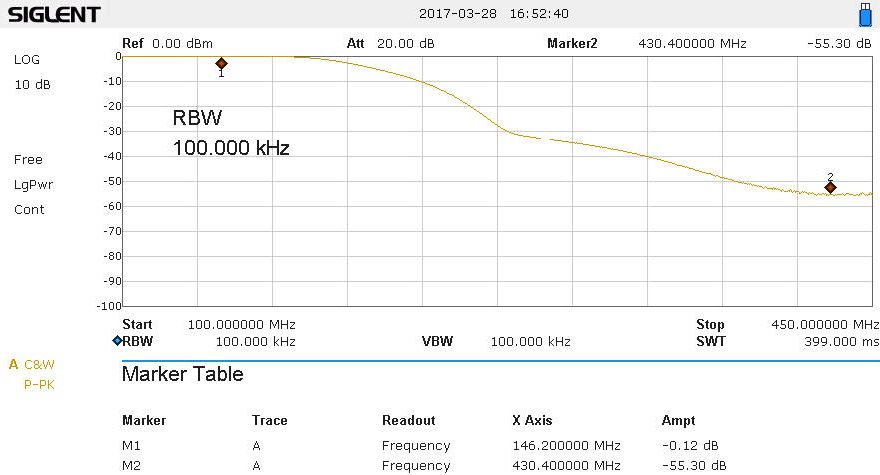
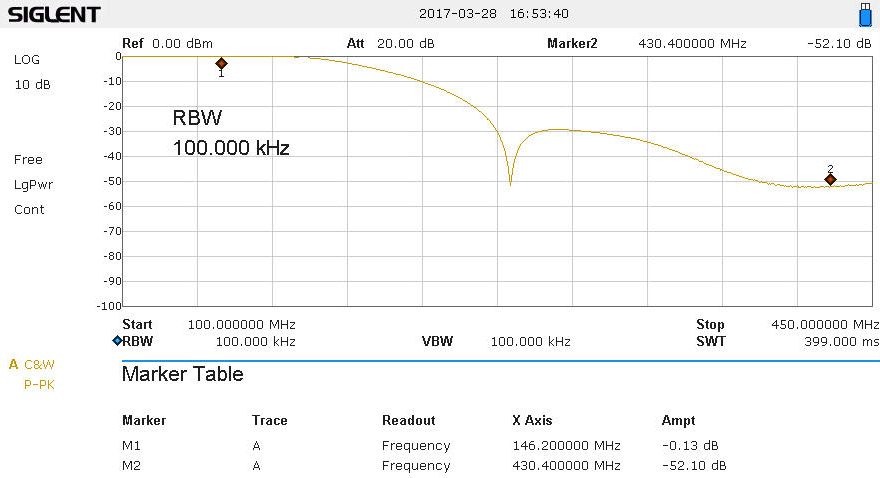
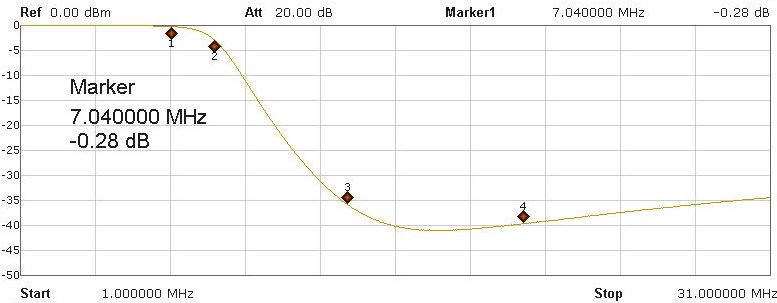
The measured response was:

  • 7.055 MHz -2.6 dB (Operating Frequency — loss is higher than expected)
  • 7.429 MHz -3.0 dB (Cutoff Frequency — a bit lower than expected)
  • 14.112 MHz -35.1 dB (2nd Harmonic)
  • 21.168 MHz -29.7 dB (3rd Harmonic)


Posted in Gear, Pixie, Projects, QRP | 1 Comment

Pixie Varibility

Given the dismal harmonic supression of my first Pixie kit, I was excited to test another. While still not passing, it is isn’t absolutely dismal.

The readings were taken with a 40 dB external attenuator.  So the fundamental is actually +25.1 dBm (or 320 mW).  The 2nd harmonic is at +3.5 dBm (2.2 mW).  This is is a reduction of 21.6 dB, still not meeting the 43 dB specification, but better than the first unit I tested, which only reduced the 2nd harmonic by 10.1 dB.

So why the difference?  Could be component variation.  Could be an assembly error.

Posted in Pixie, Projects, QRP | Leave a comment

QRP Still Rules the World; even on 80 Meters

Yesterday I decided to set my radio up on a QRP (5 watt) beacon mode on 80 meters (I used a propagation mode called WSPR, transmitting once every 10 minutes).  I let the rig run from about 4:45 PM local time yesterday to 11:00 AM this morning.  In that time, as you will see from the map, I was copied pretty much everywhere in the US and Europe.  I also made it around the globe to Tasmania (that yellow colored line heading off the bottom left corner).

Pretty much proves that QRP can work the world, even on a band like 80 meters, not usually the #1 choice for DX.

Posted in DX, Propagation, QRP | Leave a comment

Pixie Pain

There is an inexpensive QRP kit that sells on eBay for somewhere between $4-10, called a Pixie.  It is a single conversion rock bound 40 meter QRP rig often set to 7.023 MHz, but sometimes 7.040 MHz.  They are often described as a 1 or 2 watt rig.  I decided to purchase one to see how well it performs.

In various tests, I did manage to blow out the 8050 final amplifier device, and I can tell you running it at 13.8 volts is probably a big mistake as it leaves that device dissipating about 2 watts — far beyond its rating.  On the other hand, 10.4 volts (which puts the internal power rail at about 9 volts) is probably a bit on the low side.  My unit does not pass FCC emissions requirements (spurious emissions must be -43 dBc).  And being Direct Conversion, a lot of power leaks out the antenna on transmit.

The setup is as follows:
  • Pixie is driven with a 10.4 VDC power supply (and consumes 10 mA in receive and 60 mA in transmit)
  • Output power measured with a QRP watt meter is 140 mW at 10.4 VDC input.
  • Pixie is terminated with a 50 ohm dummy load.
  • The Oscilloscope is in parallel with the dummy load (1x probe setting)
  • The Spectrum Analyzer is fed with a 40 dB external attenuator.
Let’s begin with the RX scope photo, which shows 112 mVrms (calculated by the scope) and 332 mVpp.  At 50 ohms that is 0.25 mW, or -6 dBm:
Inline image 1
Moving on to the TX photograph, which shows 7.04 V p-p, which is 2.49 Vrms.  which is 125 mW, or 21.0 dBm:
Inline image 2
Moving to the frequency domain — (add +40 to all values due to external attenuator).  The fundamental on receive is leaking through at -6.38 dBm, which is .23 mW.  Adding in the second and third harmonics gets us to .25 mW, exactly what we see on the O-scope:
Inline image 4
On TX we have the fundamental at +19.7 dBm (94 mW).  The second harmonic is 9.58 dBm (9.1 mW).  The third harmonic is -8.17 dBc (0.2 mW).  That’s a total of 103 mW, a bit lower than the scope reading of 125 mW:
Inline image 3
Posted in Gear, Pixie, QRP | 1 Comment

HELP: My TH-D74A Radio Won’t Go into DV Mode

Well, not MY TH-D74A, but that was a problem a friend was having with his new Kenwood TH-D74A radio.  He could NOT select a memory channel programmed to DSTAR (Kenwood calls that DV for Digital Voice, or DR for Digital Repeater).  Also he could not use the “MODE” button (one of the buttons on the keypad) to select DV.  It would cycle through FM, AM, USB, LSB, CW, and back to FM).

Calls to Kenwood were not productive:  “If you press the MODE button it will allow you to select DV”, followed by “No I know of no reason why DV isn’t showing up as a choice on your radio.  It has to be there.”  And the Yahoo group was full of good suggestions, but none of them fixed the issue.

My friend knew it COULD work, because it did work briefly — he was able to select MODE DV, or pick a DSTAR memory channel, but that happened after hours (and I mean like 12 solid hours) of “lets try this” button pushing.

It isn’t my radio, so that made life quite difficult, and it’s a long drive to his house and back.  I finally downloaded the manual and read the DSTAR and Memory Channel sections of the book from end-to-end and there was absolutely NOTHING in there to describe the problem.  So I read the entire manual (did I mention it was for a radio I do NOT own?  How many people read the manual for radios they DO own?).  Finally I found three little notes at the end of a unrelated chapter.  One of them said “The radio may be in DV Mode in Band A or Band B but not both”.

Like many radios, the TH-D74A can be configured to monitor two frequencies at the same time.  These two monitored frequencies, for reasons beyond my understanding, are called “BANDS” — Band A, and Band B.  Band A might be tuned to a 70 cm repeater, and Band B might be tuned to a 2 meter repeater.  You will hear both repeaters through the speaker, and will transmit to whichever band you are currently set to (A or B).

Unlike Icom, which also has this dual monitor function, Kenwood does not support the ability to have Band A set to a DSTAR repeater and Band B set to a different DSTAR repeater.  It can only handle one DV connection.  that’s what that fine print note meant.  You can set Band A to DV or Band B to DV, but BOTH A and B can’t be set to DV.

Well it’s easy to understand the limitation (maybe the Icom rigs have two CODEC chips installed), but to understand the implication of what that means to a user is a difficult thing.  In Kenwood TH-D74A world, that means that if Band B is set to DV, and you select Band A as the active one, then the MODE button can’t select DV, and the selector knob on top of the radio can’t select a DSTAR channel.  As a comic once said, “that’s BDONG (Bad/wrong)”.  The user is clearly trying to activate Band A, so why does a setting in Band B continue to take precedence — shut down Band B for heaven’s sake or do something else clever, but don’t be stupid and lock out DV from Band A).

Unfortunately Kenwood support folks don’t understand that, so when my friend called them and said, “HELP, my Kenwood TH-D74A won’t go into DV mode” the support folks were unable to help him — they just insisted that the Mode and Channel selector SHOULD work.  That lead to two very frustrated hams (my friend and myself) being left to figure out how the radio actually worked.

I will give Kenwood props up for a pretty good speech synthesizer — my friend is blind and it’s important for the radio to speak to help him walk through menus.  But even that is only partially implemented in the TH-D74A.  We discovered the synthesizer stops speaking and doesn’t guide the user through anything to do with microSD card.

Posted in TH-D74A | 10 Comments

Fixing the “Solar_Terrestrial Data” Widget

Paul Herrman, N0NBH, has been providing Solar-Terrestrial Data banners for many years to hams for use on their websites.  One of them is a Widget used by many on WordPress sites, originally authored by Tom, NS6T.  That’s the widget I’ve been using.  However, its behavior with Chrome browsers has been problematic as Chrome seems far more likely to use a cached image than some other browsers.  So when I checked my website today, I saw the following from Jan 13, as opposed to the current Feb 1 info:

Tom’s widget works by going to a specific link on Paul’s website which contains an image that he updates daily.  But that image always has the same name, and that is what confuses the browser into using a cached version of the image. (The link for the image above would be:  http://www.hamqsl.com/solarvhf.php).

I decided to stop using Tom’s widget (not entirely fair, since the problem is with the browser, not the widget itself).  So I changed over to a “Text” widget with the following text:

The key difference is adding the “?<?=rand(1,32000)?” into the img src line.  That information is cached along with the image, and each time that part of the screen is refreshed, the information will be different, causing the image to be reloaded fresh.

So how to do that in WordPress?  Go to Appearance/Widgets:

Either remove the old Solar Terrestrial Data widget, or add a new one using a Text Widget box.  Don’t forget to “Save” when you are finished.

Now I get recent data on my WordPress site.


Posted in From the OM | 5 Comments